If you’ve ever taken even a cursory glance at a hurricane forecast, you’ve seen some version of the “cone of uncertainty.” It sounds like some other-dimensional realm of indecision, but it’s a mainstay for communicating hurricane forecasts. Though these maps pack in plenty of valuable information, it can be a bit tricky to interpret them if you don’t know exactly what you’re looking at.
Here Scientific American walks you through all the forecast components and what they mean—and, almost as crucially, what they don’t. We also point you to some other resources that are often the most helpful for those staring down an approaching storm.
NHC Forecast
On supporting science journalism
If you’re enjoying this article, consider supporting our award-winning journalism by subscribing. By purchasing a subscription you are helping to ensure the future of impactful stories about the discoveries and ideas shaping our world today.
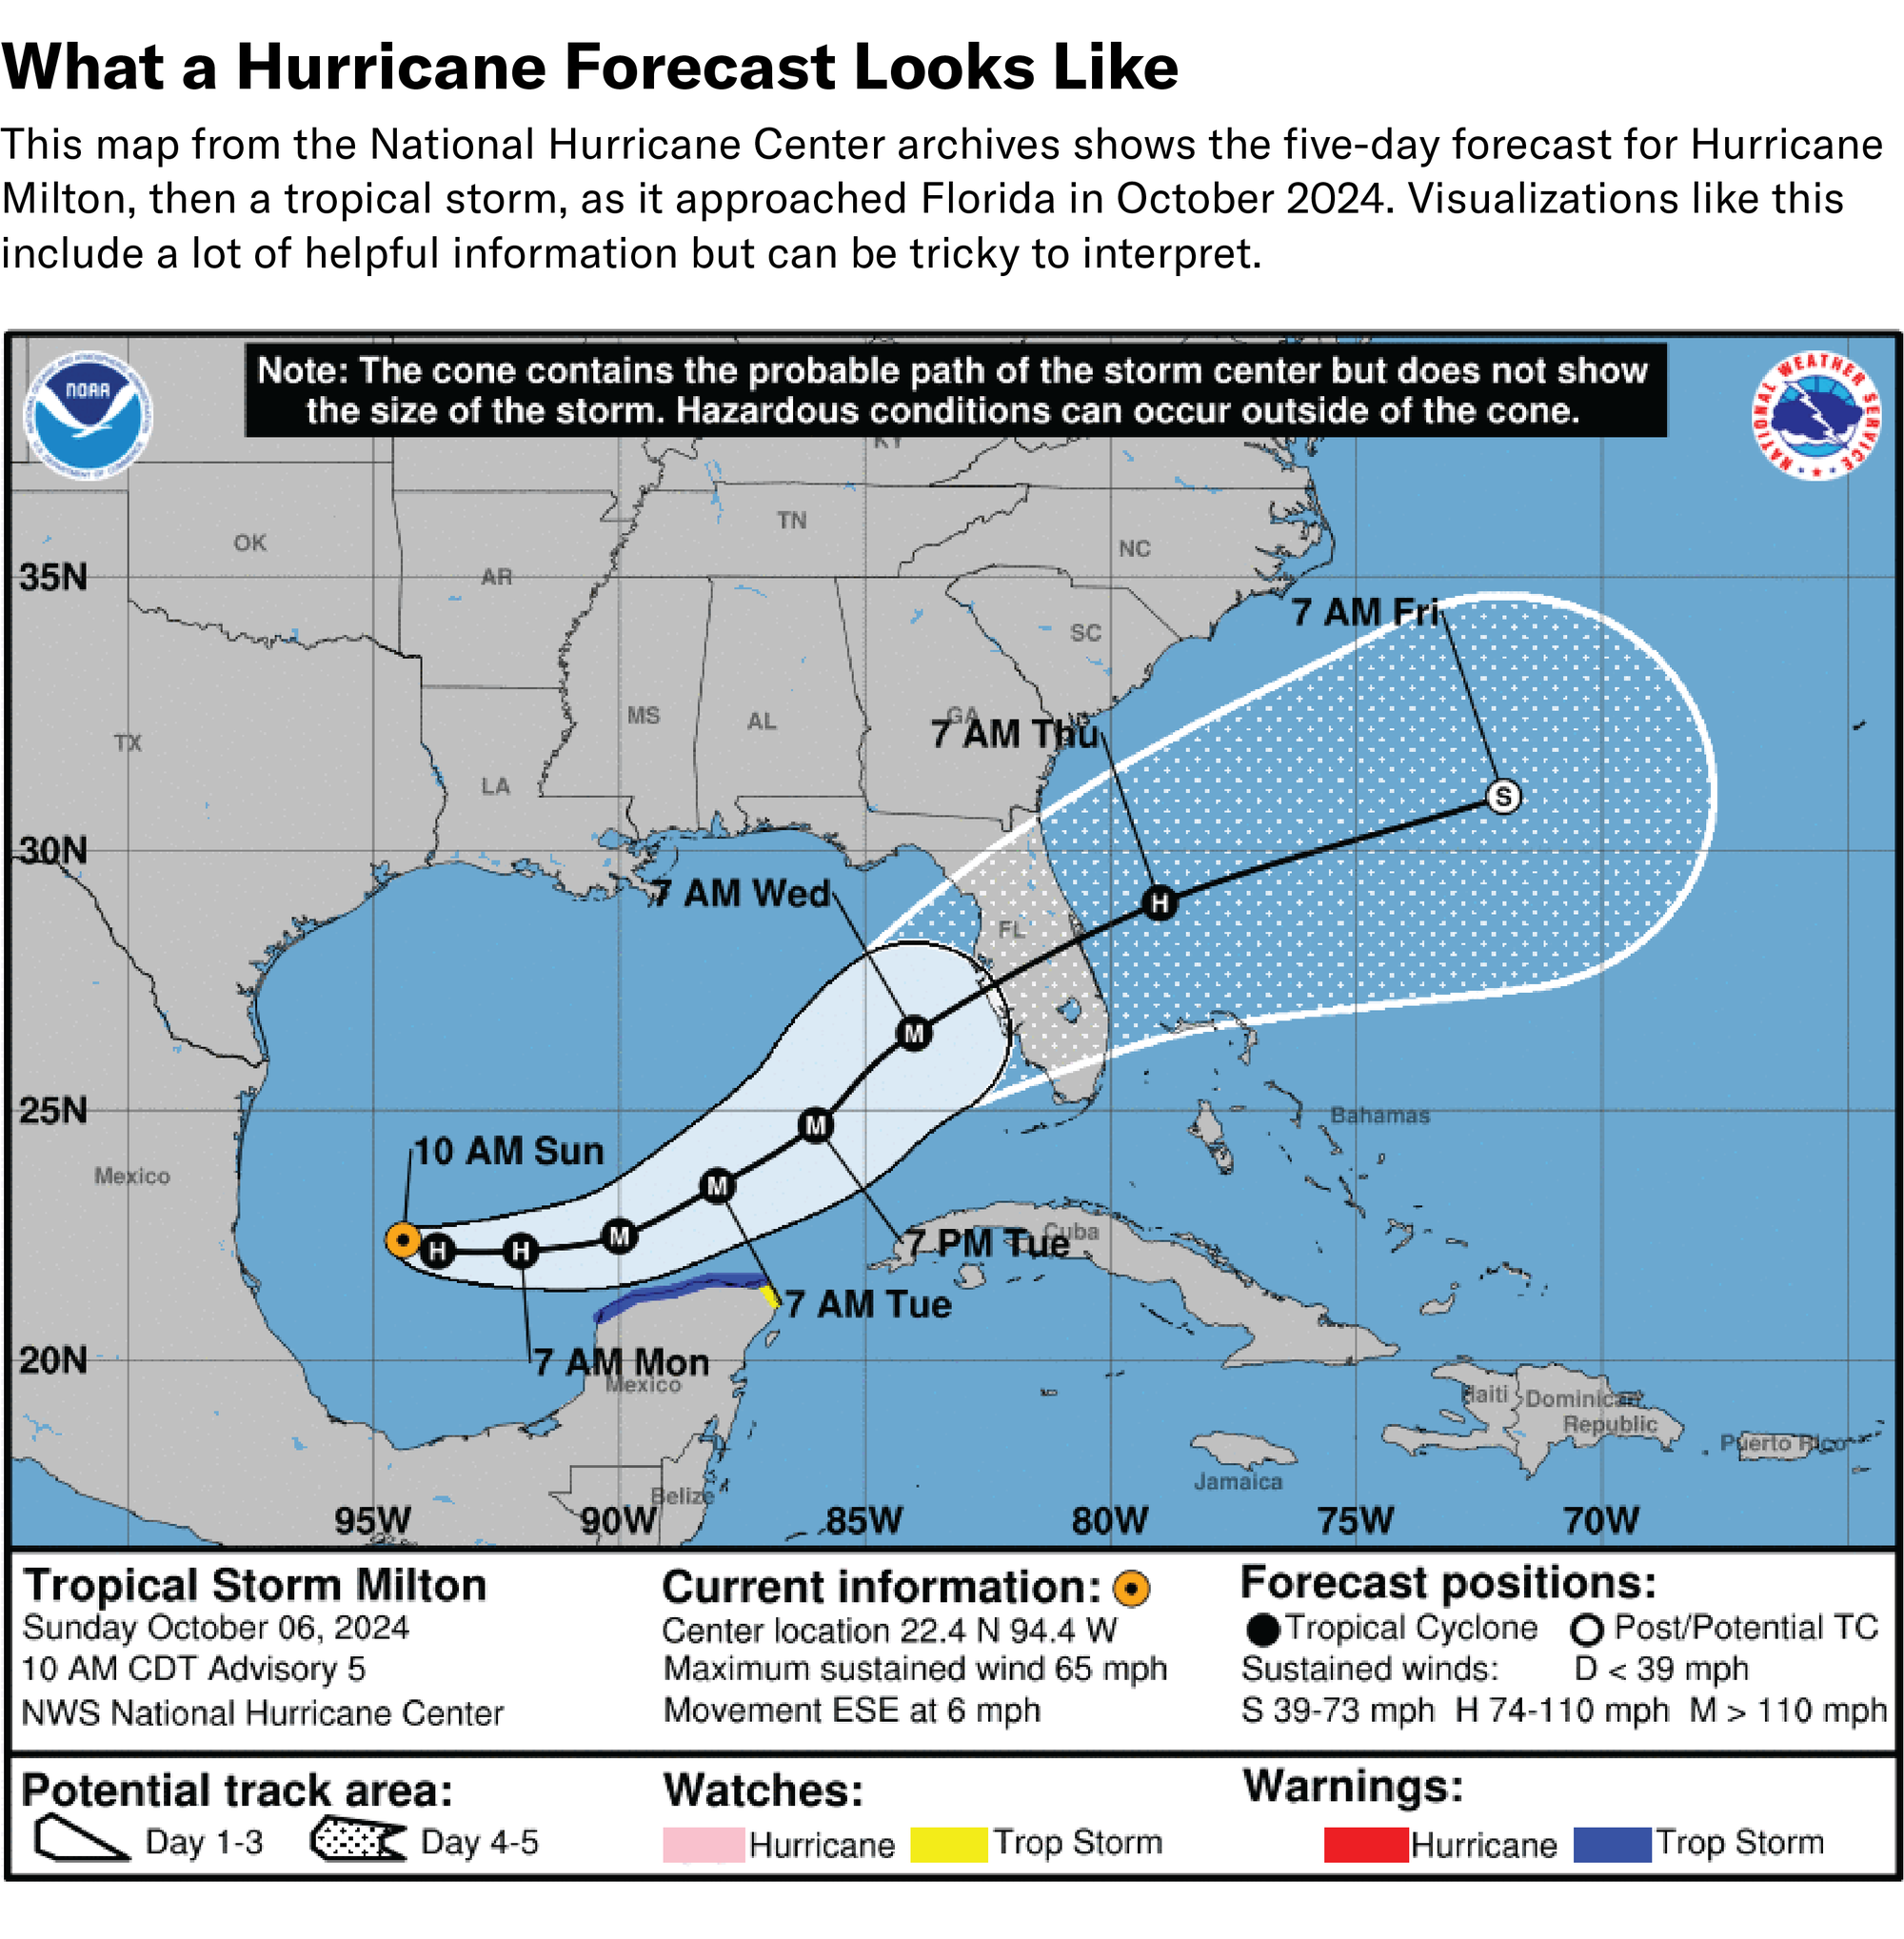
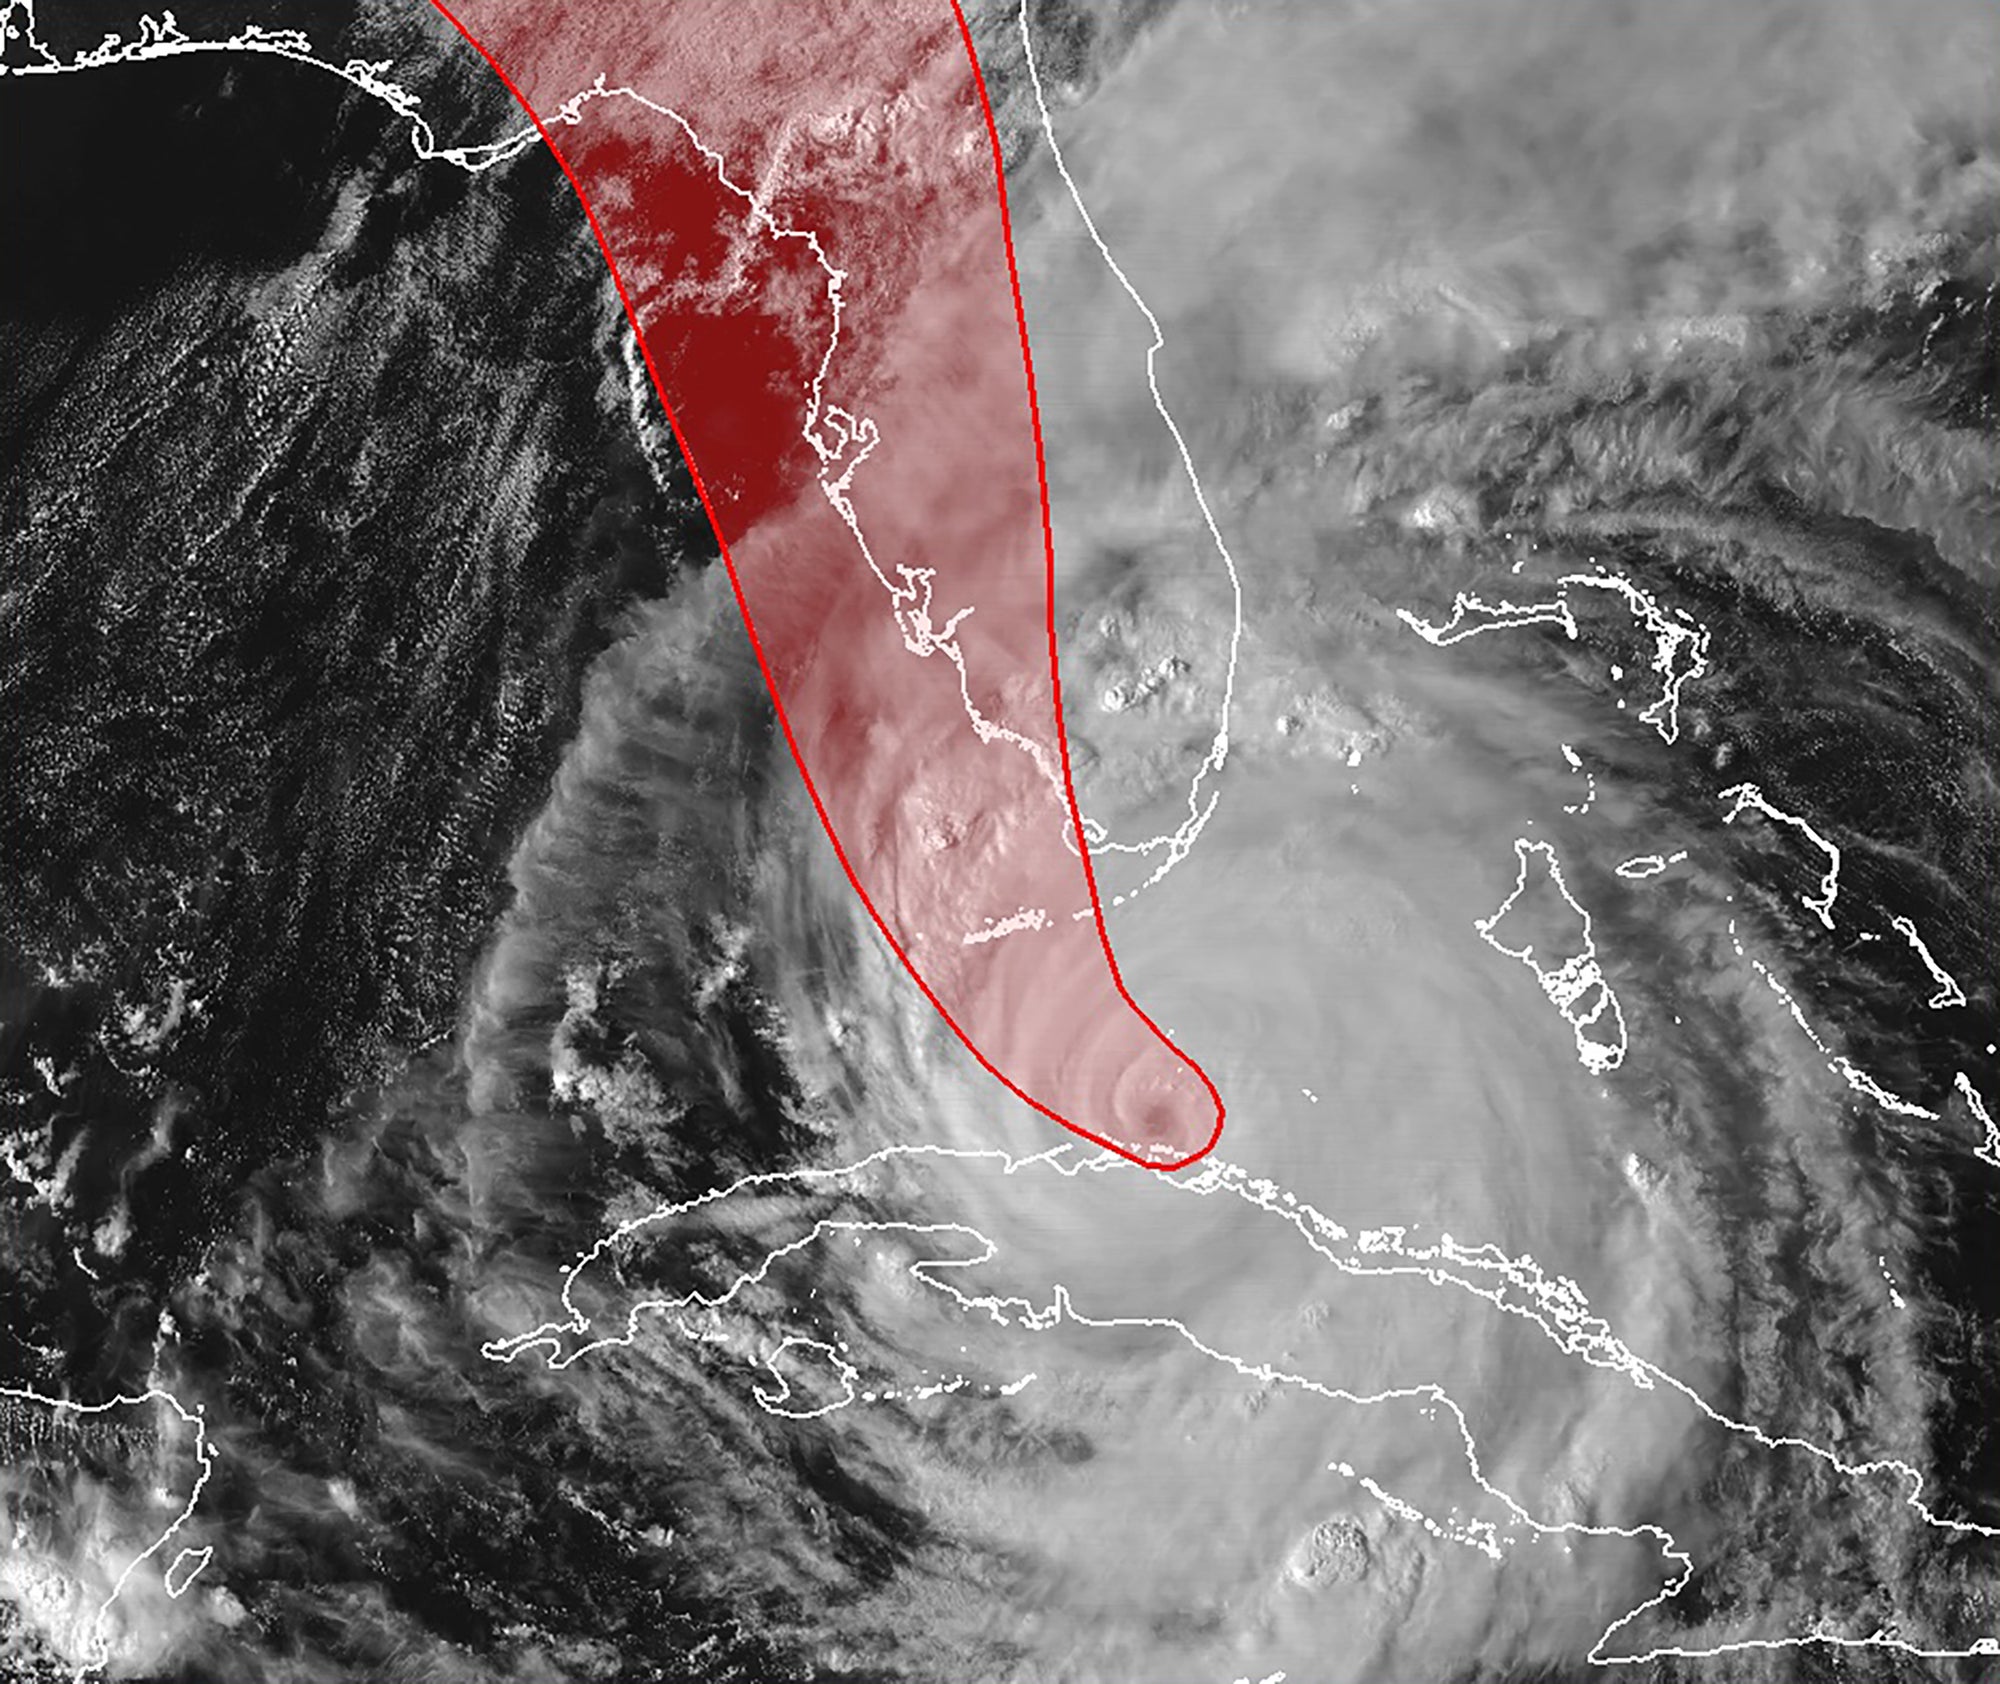
Above is an example of what you might see if you visit the National Hurricane Center’s (NHC’s) website during a storm in progress—in this case it’s an archived forecast from 2024’s Hurricane Milton. Various broadcasters, news sites and other groups that cover the weather often have their own versions of this map. There’s a lot happening here, so let’s break things down piece by piece.
Timeline
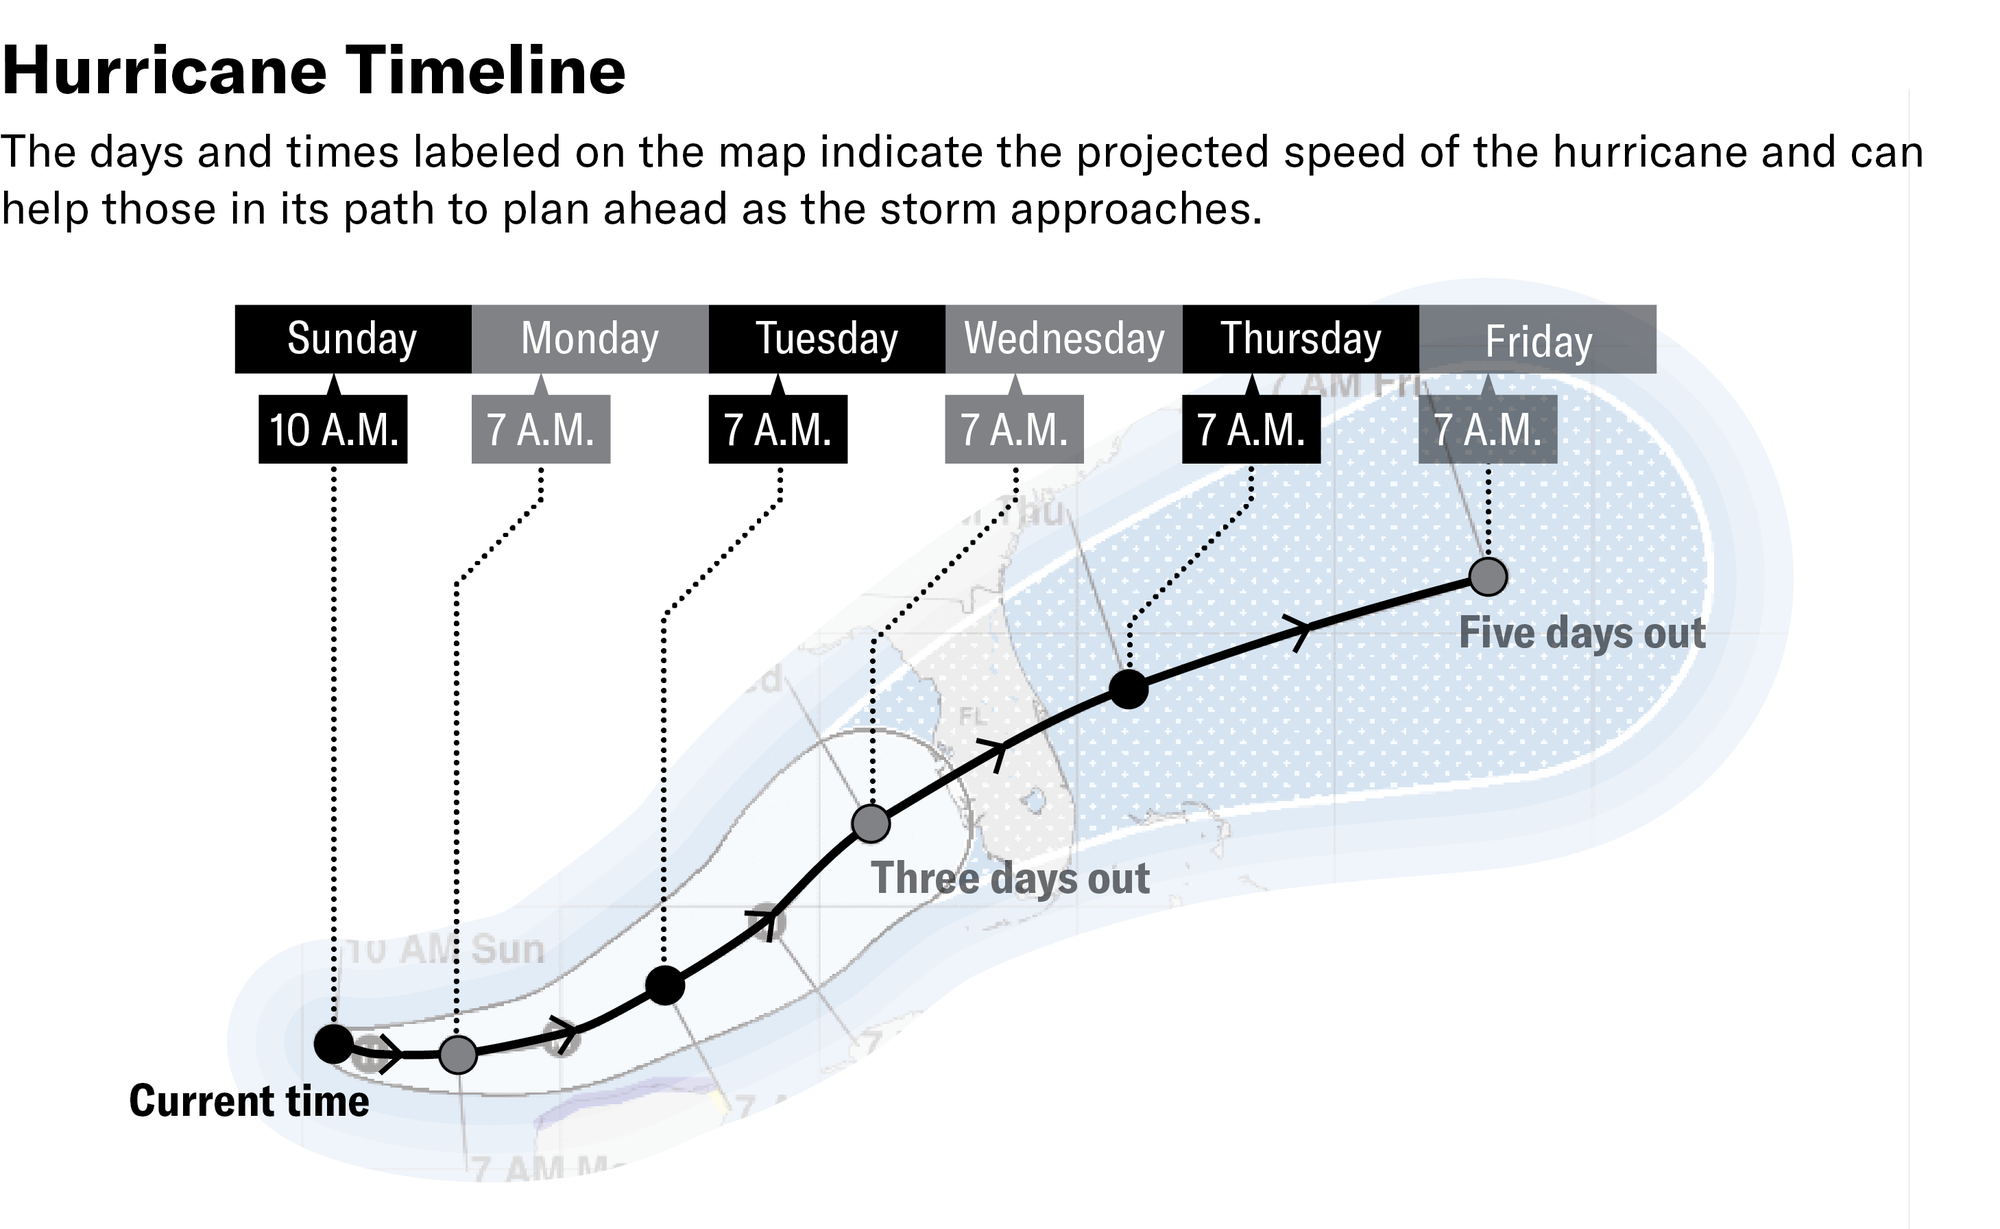
First off, because the cone-of-uncertainty graphic is a depiction of a forecast, it’s looking into the future. Each update to the map shows the storm’s current location, then roughly where the center of the storm will be over the next three to five days (depending on which version you are looking at).
Cone of Uncertainty
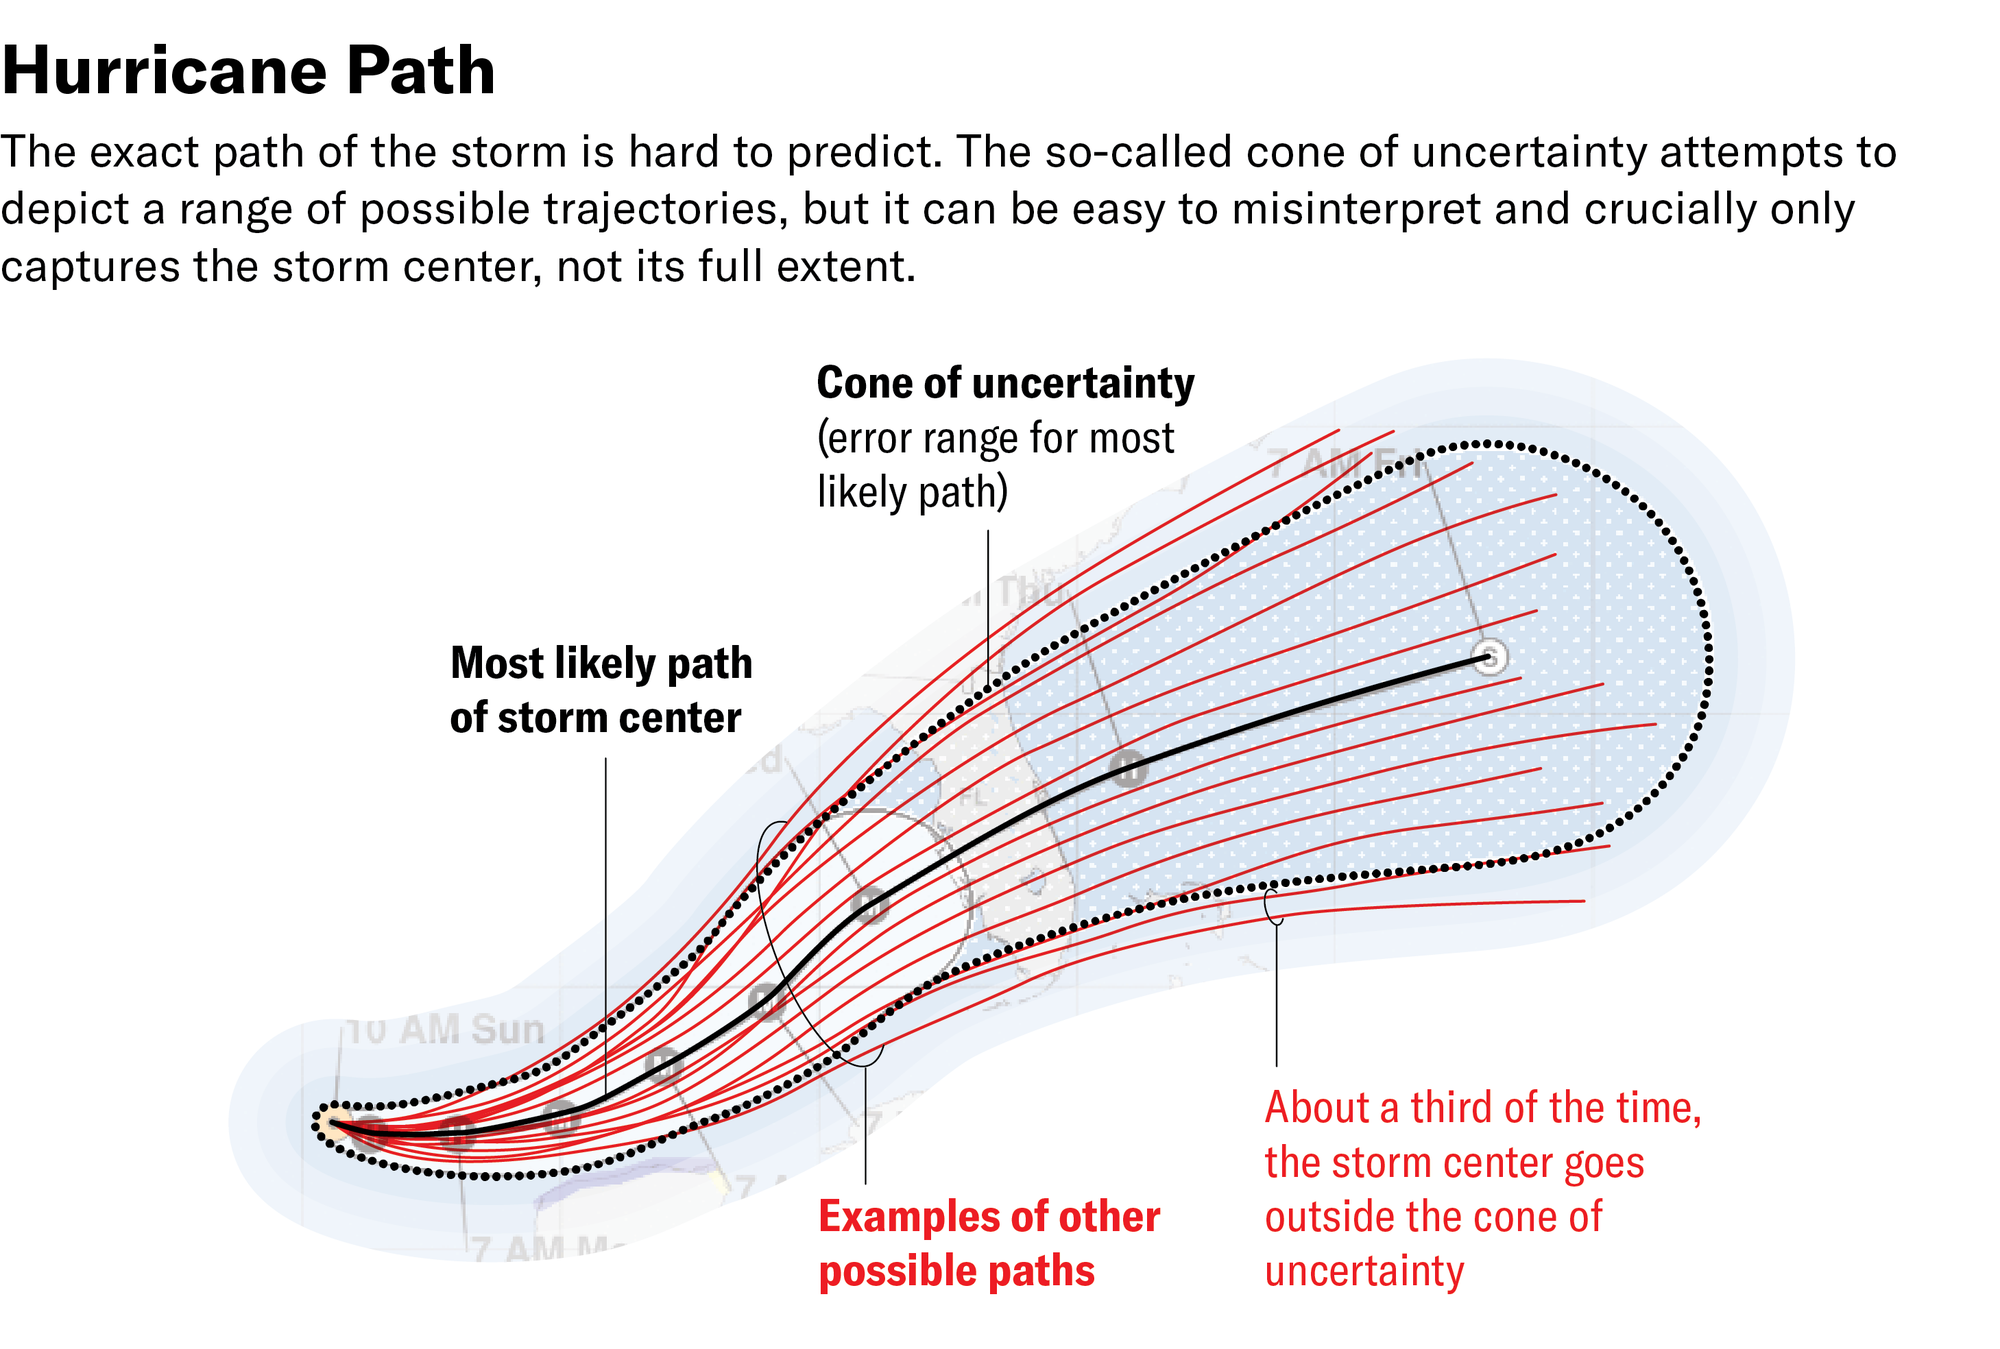
This is the centerpiece of the graphic—the actual cone of uncertainty—so called because it is an indicator of the possible error range in that forecast of where a tropical storm or hurricane is headed.
The first key point in understanding the cone is that the error isn’t based on the specific storm forecast; rather, it’s an average of the overall forecast error over the past five years. So the more forecasts improve, the narrower the cone gets. The cone gets its shape because “the uncertainty increases with time,” says Brian McNoldy, a hurricane researcher at the University of Miami. It’s easier to forecast the near future than several days out.
And because the error is based on that long-term forecast average, “you get the exact same cone all year long for every storm,” McNoldy says. It can appear different—for example, more squat or elongated—because of how fast or slow the storm is going.
The cone is meant to encompass where a storm actually goes two thirds of the time, so “the cone is designed to fail one third of the time,” says James Franklin, former chief of the NHC’s Hurricane Specialist Unit. So two thirds of the time, the storm will follow some path within the cone, but about one third of the time, its center will venture outside of the cone as the storm progresses. This is one reason why you never want to assume that because you’re just outside of the cone, you’re in the clear.
The other reason is that the cone only tracks the path of the storm’s center—it does not mean the storm’s impacts are limited to the area of the cone. “It isn’t accounting for how big the storm is,” or if a storm’s winds and rains are concentrated on one side, says Kim Wood, an atmospheric scientist at the University of Arizona. “It really makes no sense to look at the cone, see that you’re outside of it and then ignore everything else,” Franklin says.
Storm Strength
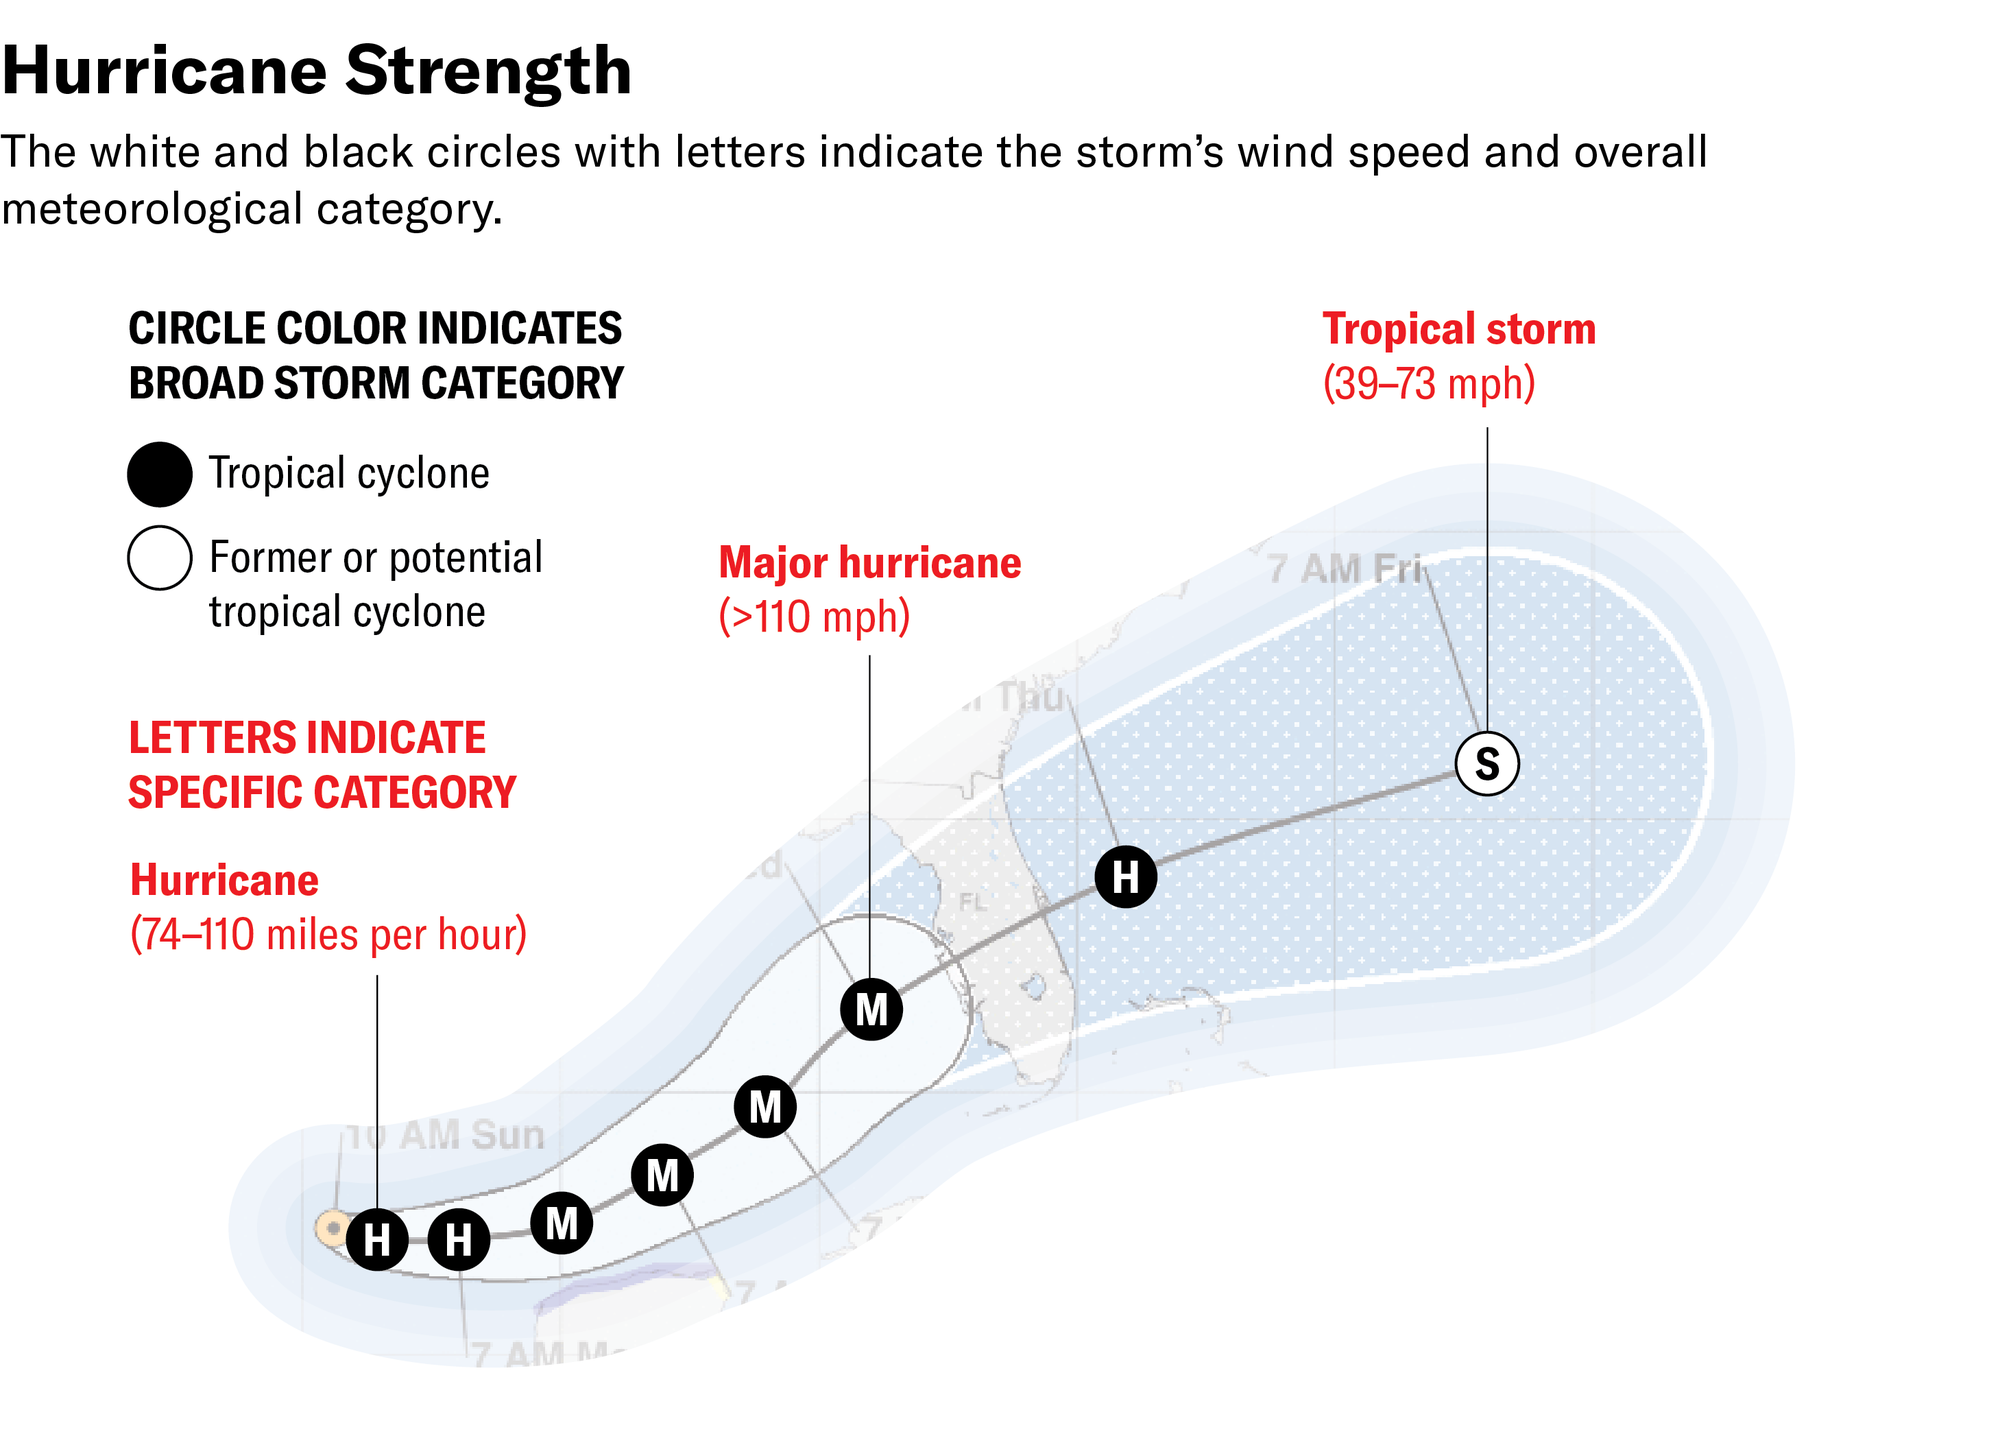
The map also includes the expected form of the storm at various points in the future, which are denoted with black or white circles and letters. The letters show whether a storm will be a tropical depression (D), tropical storm (S), hurricane (H) or major hurricane (M). (A major hurricane is a Category 3 or higher on the Saffir-Simpson scale.)
A black circle means the storm is a tropical cyclone, or one that derives its strength from heat-driven convection at its core. A white circle denotes a potential tropical cyclone (one that could become a tropical cyclone) or a former one—often a storm that is now extratropical, meaning it is driven more by a temperature difference across a weather front than by convection.
READ MORE: Hurricane Science Has a Lot of Jargon—Here’s What It All Means
There are also color-coded indicators of hurricane and tropical storm watches and warnings.
But these indicators are only based on a storm’s wind speeds—they don’t suggest anything about potential storm surge, rainfall or tornadoes, all of which can be threats from tropical cyclones.
Another Way
NHC forecasts—including the cone of uncertainty graphic—are useful, but they are intended mostly for other meteorologists and emergency managers that use that information to make more detailed local forecasts and decisions about where people should evacuate or position supplies. “The NHC is not issuing information for a person,” Wood says.
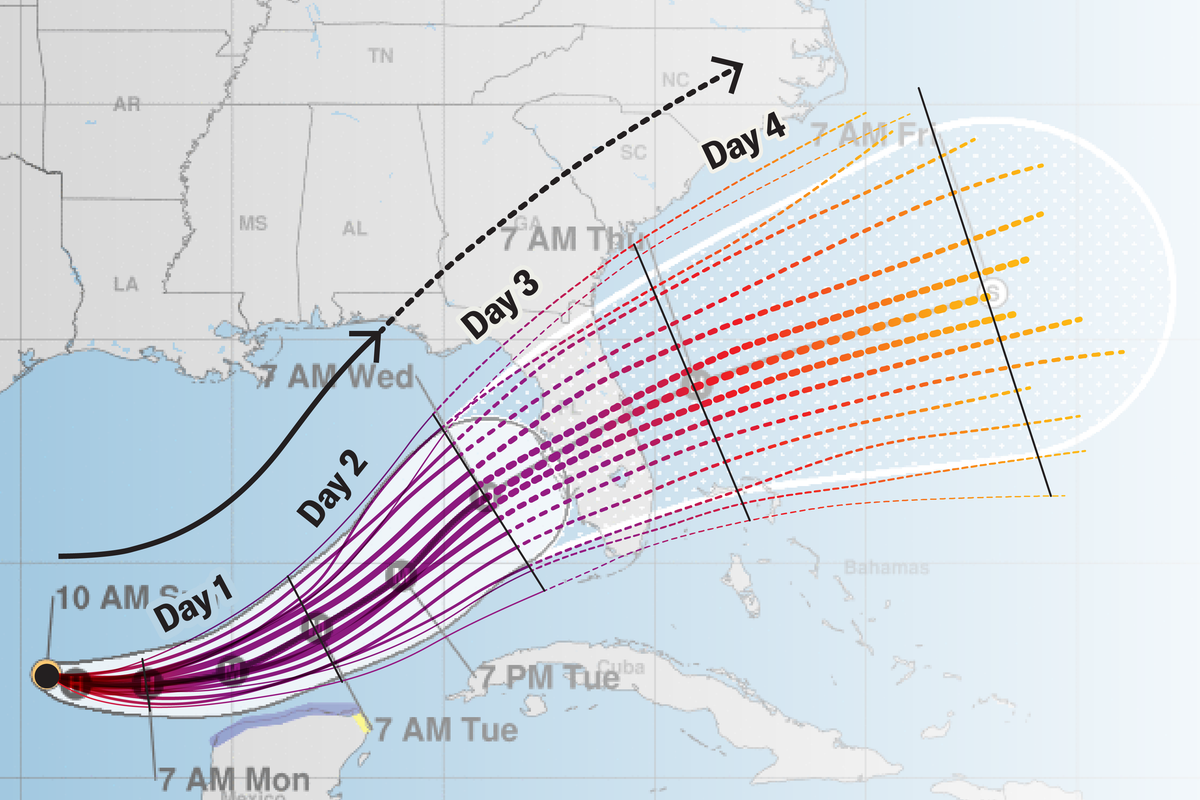
Some researchers have explored making versions of the cone that are more useful for communicating threats. A 2019 study found that people estimated more damage from a hurricane when a forecast track went over a location than when it didn’t. The researchers suggested that forecasts should show more hurricane paths to convey the uncertainty in where a hurricane would go.
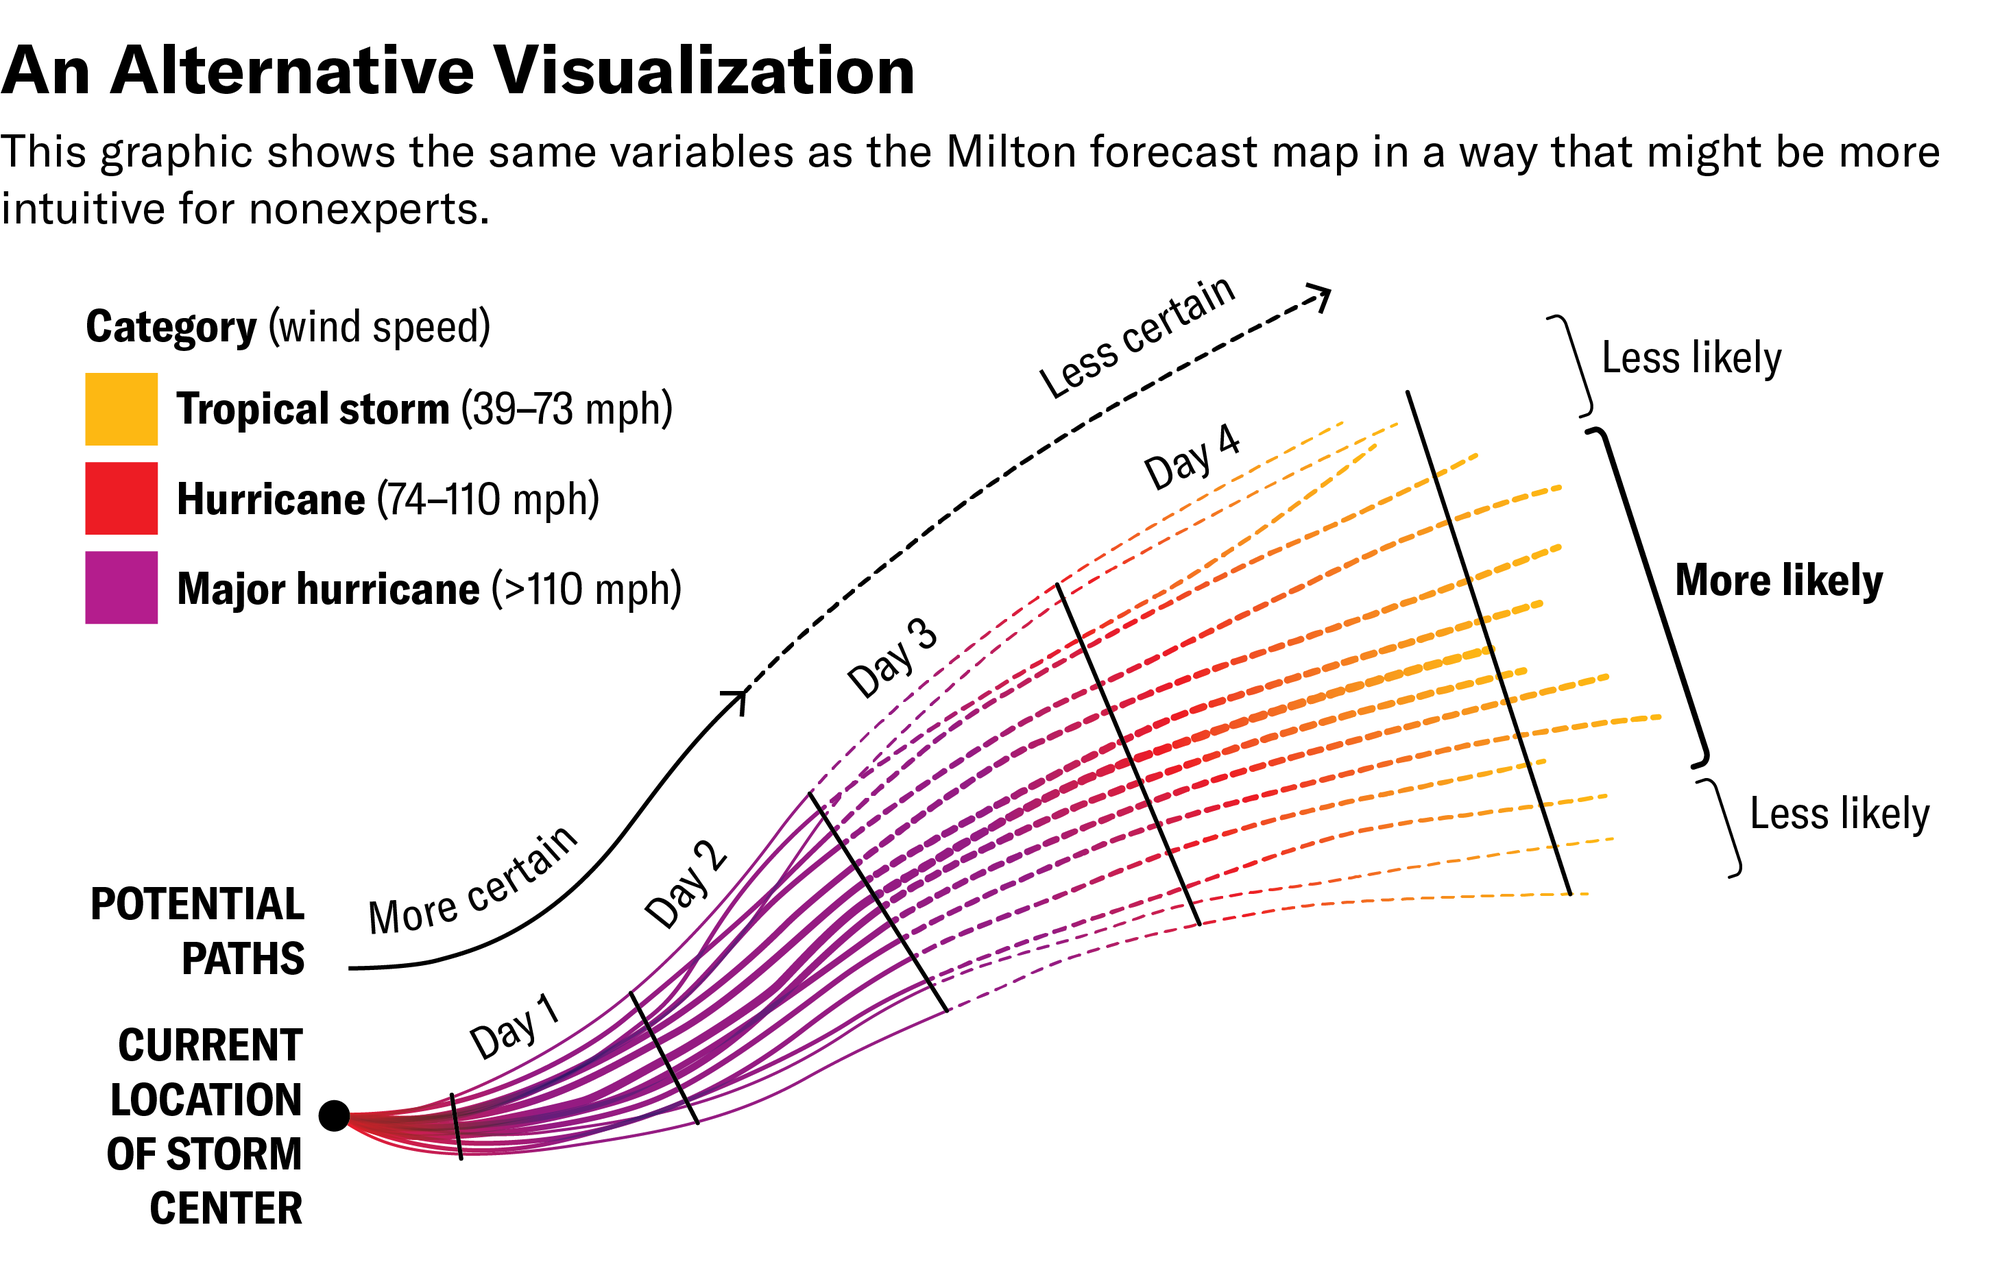
The graphic above is an example of such a visualization. It shows that the forecast is more certain in the near future and that paths at the outside of the cone are less likely than those at the center—but still possible.
The cone graphic as it exists now can still be useful when looking out four or more days before a storm might arrive to get a general sense of where it is now and where it is going—for example, if a storm in the Gulf of Mexico looks likely to curve into Florida, people in New Orleans may not need to be as alert. “It can be a decent starting point in just getting oriented into what the threat might be,” Franklin says. “It’s a good place to start, but you don’t want to stop there.”
Other Sources of Hurricane Information
So where should you go for more useful hurricane information? Paying attention to a trusted local weather source, such as your local National Weather Service office, is generally the best bet for keeping up with impacts specific to your area and what steps need to be taken, such as whether to evacuate.
The NHC also has maps that show when tropical-storm- and hurricane-force winds are likely to arrive at given locations and detailed maps showing expected storm surge levels. Much of this information is pulled together on the National Weather Service’s Hurricane Threats and Impacts Tool, as well. This interactive map overlays the cone of a storm on top of wind, tornado, storm surge and rain threat information. You can click a given location and it will tell you what hazards you need to be concerned about.
One of the most important things to remember no matter what forecast you’re looking at is that forecasts change. Small variations in the storm itself or the larger atmospheric patterns can shift a storm’s path or intensity.
Human brains can naturally fall prey to the “anchoring effect”—we can become mentally rooted in one specific forecast and base our decisions on it rather than updating our thinking as conditions change. Maybe there’s a particularly ominous forecast or a particularly good one for your location, “and then you don’t keep looking for updates,” McNoldy says. But checking for updates is crucial to get ready for the coming storm.